Debugging
Parallel applications are difficult to debug. Depending on the kind of problem, the type of parallelism, some tools may provide a great help in the debugging process.
Summary
Name |
MPI |
OpenMP |
Cuda |
GUI |
Step by step |
Memory Debugging |
|---|---|---|---|---|---|---|
Linaro-forge DDT |
✓ |
✓ |
✓ |
✓ |
✓ |
✓ |
GDB |
✓ |
|||||
PDB |
✓ |
|||||
Intel Inspector |
✓ |
✓ |
✓ |
|||
Totalview |
✓ |
✓ |
✓ |
✓ |
✓ |
✓ |
Valgrind |
✓ |
✓ |
To display a list of all available debuggers use the search option of the module command:
$ module search debugger
Compiler flags
Common flags
To debug codes, you need to enable debug symbols. You get these symbols by compiling with the appropriate options:
-gto generate debug symbols usable by most debugging and profiling tools.or
-g3to generate even more debugging information (available for GNU and Intel, C, C++ or Fortran compilers).and optionally
-O0to avoid code optimization (this is strongly recommended for first debug sessions).
Flags for Fortran
-tracebackwith ifort or-fbacktracewith gfortran: specifies that a backtrace should be produced if the program crashes, showing which functions or subroutines were being called when the error occurs.
For example, when getting a segmentation fault in Fortran, you may get the following error message which is not very useful:
forrtl: severe (174): SIGSEGV, segmentation fault occurred
Image    PC               Routine Line    Source
run_exe  000000010005EAC7 Unknown Unknown Unknown
run_exe  000000010005DDA9 Unknown Unknown Unknown
run_exe  00000001000009BC Unknown Unknown Unknown
run_exe  0000000100000954 Unknown Unknown Unknown
A code compiled with -fbacktrace or -traceback will give a more relevant output:
forrtl: severe (174): SIGSEGV, segmentation fault occurred
Image    PC               Routine   Line    Source
run_exe  000000010005EAC7 test_m_   265     mod_test.f90
run_exe  000000010005DDA9 io_       52      io.f90
run_exe  00000001000009BC setup_    65      test_Setup.f90
run_exe  0000000100000954 main_     110     launch.f90
-check boundswith ifort or-fbounds-checkwith gfortran: checks that an index is within the bounds of the array each time an array element is accessed. This option is expected to substantially slow down program execution but is a convenient way to track down bugs related to arrays. Without this flag, an illegal array access would produce either a subtle error that might not become apparent until much later in the program or will cause an immediate segmentation fault with poor information on the origin of the error.
Note
Be careful. Most of these compiler options will slow down your code performances.
GDB
GDB is the Gnu DeBugger. It is a lightweight simple serial debugger available on most systems.
To start a program under GDB, first make sure it is compiled with -g. Start a GDB session for your code:
$ gdb ./gdb_test
GNU gdb (GDB) Red Hat Enterprise Linux
Copyright (C) 2010 Free Software Foundation, Inc.
(gdb)
Once the GDB session is started, launch the code with:
(gdb) run
If an error occurs, you will be able to get information with backtrace:
Program received signal SIGSEGV, Segmentation fault.
(gdb) backtrace
#0  0x00000000004005e0 in func1 (rank=1) at test.c:14
#1  0x0000000000400667 in main (argc=1, argv=0x7fffffffacc8) at test.c:30
GDB allows to set breakpoints, run the code step by step and more. See man gdb for more information and options.
GDB can be used on one process at a time with a parallel program. To attach GDB to a running process you may use the following method :
Compile the program with debug options.
Start the program
Find on wich nodes the program is running using the ccc_mpp -u $USER command
Connect to a compute node used by the program, using the ssh <compute node> command
Find the process ID of your application using the ps -fu command
Connect to a running process using the gdb -p <process id> command
You can use gdb on several processes at the same time.
DDT
DDT is a highly scalable debugger specifically adapted to supercomputers.
Basics
You can use DDT after loading the appropriate module:
$ module load linaro-forge
Note
Allinea-forge has been renamed Arm-forge, which has then been renamed Linaro-forge.
Then use the command ddt. For parallel codes, edit your submission script and replace the line
$ ccc_mprun -n 16 ./a.out
with:
$ ddt -n 16 ./a.out
You may want to add the -noqueue option to make sure DDT will not submit a new job to the scheduler. You have to specify the good version of the mpi distribution by selecting run and select SLURM (generic) implementation as shown on the figures below.
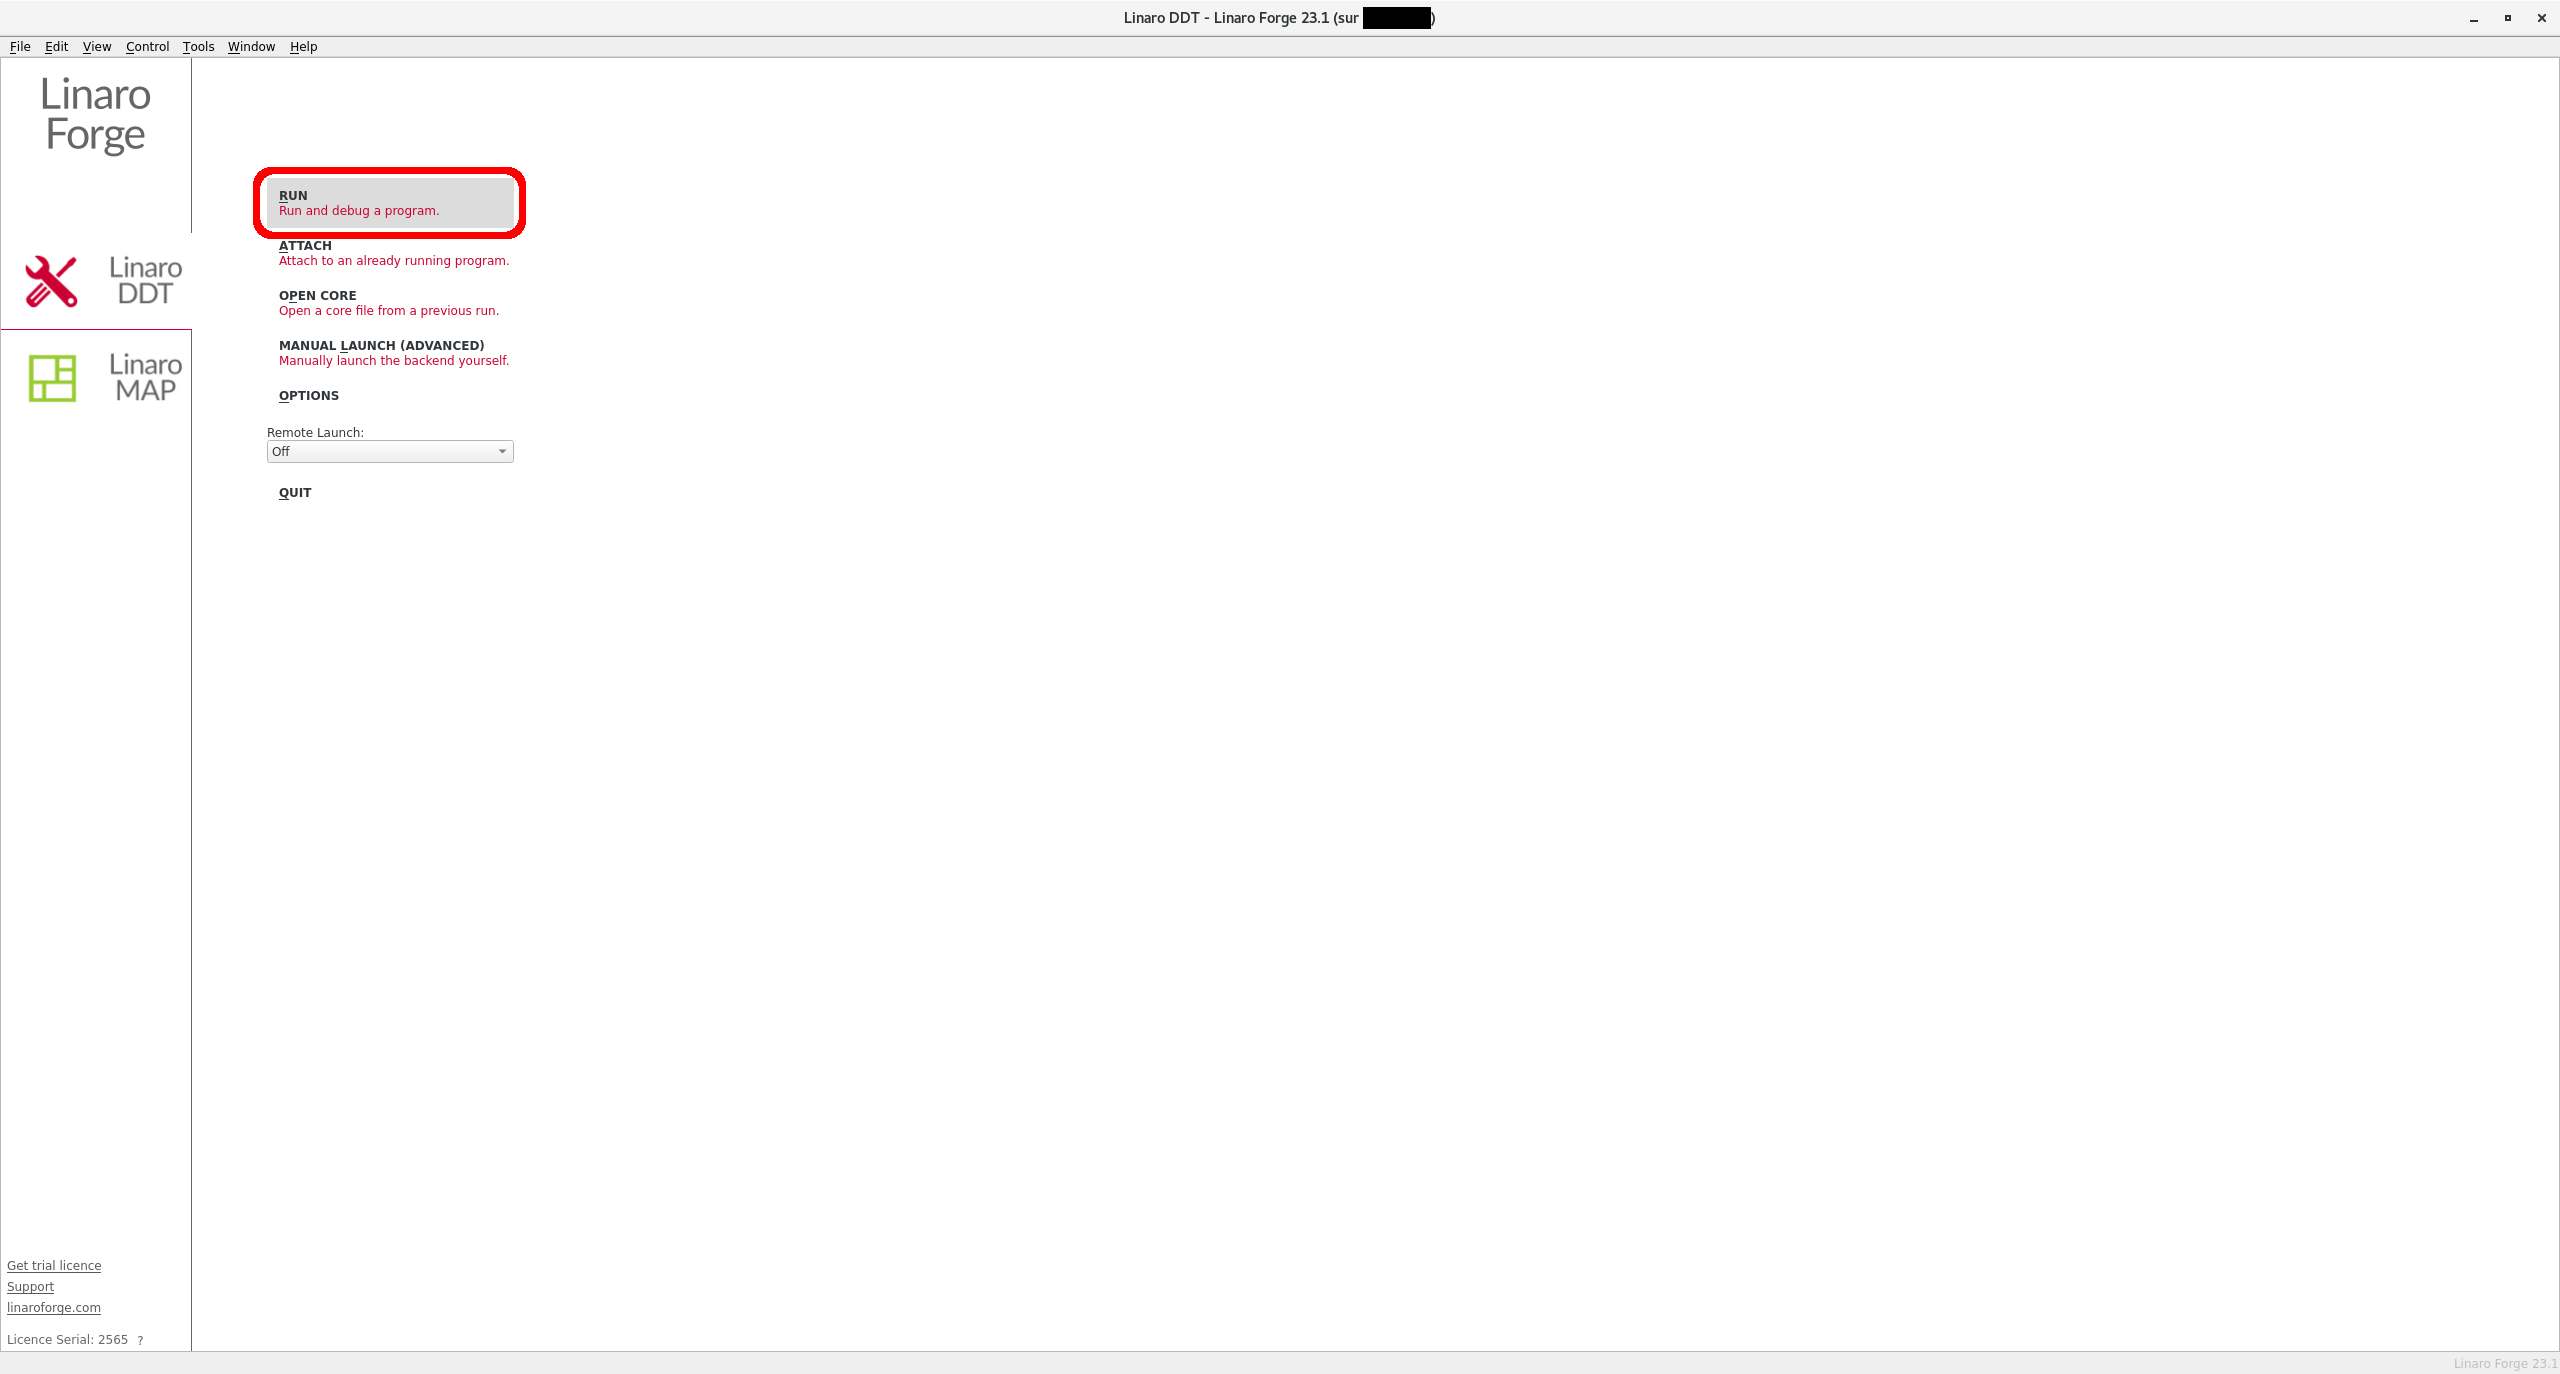
DDT opening window: choose ‘Run’
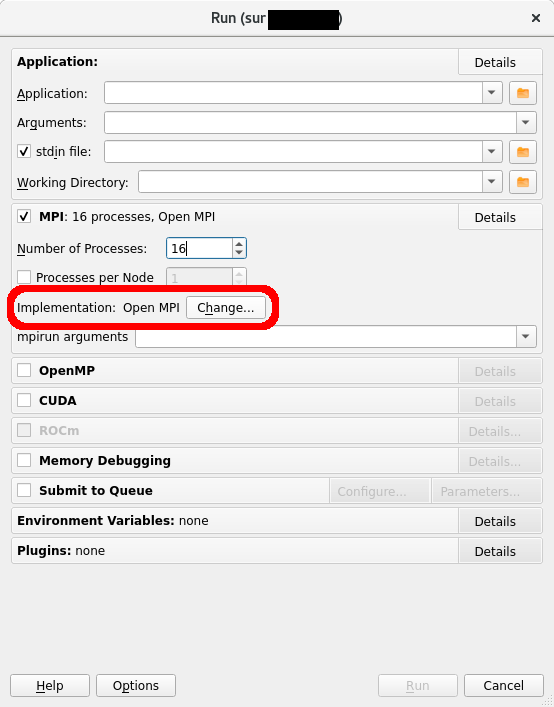
Choose ‘change’
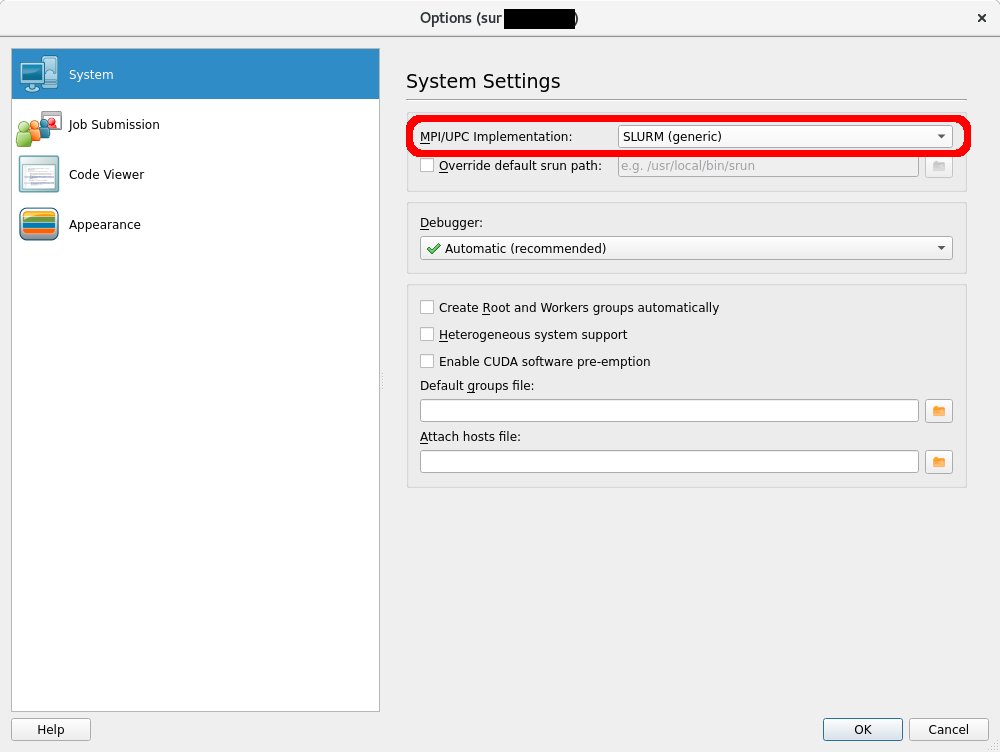
Choose ‘SLURM (generic)’
Example of submission script:
$ cat ddt.job
#!/bin/bash
#MSUB -r MyJob_Para       # Job name
#MSUB -q <partition>      # Partition name
#MSUB -A <project>        # Project ID
#MSUB -n 32               # Number of tasks to use
#MSUB -T 1800             # Elapsed time limit in seconds
#MSUB -o example_%I.o     # Standard output. %I is the job id
#MSUB -e example_%I.e     # Error output. %I is the job id
set -x
cd ${BRIDGE_MSUB_PWD}
ddt -n 32 ./ddt_test

$ ccc_msub -X ddt.job
Note
The -X option for ccc_msub enables X11 forwarding.
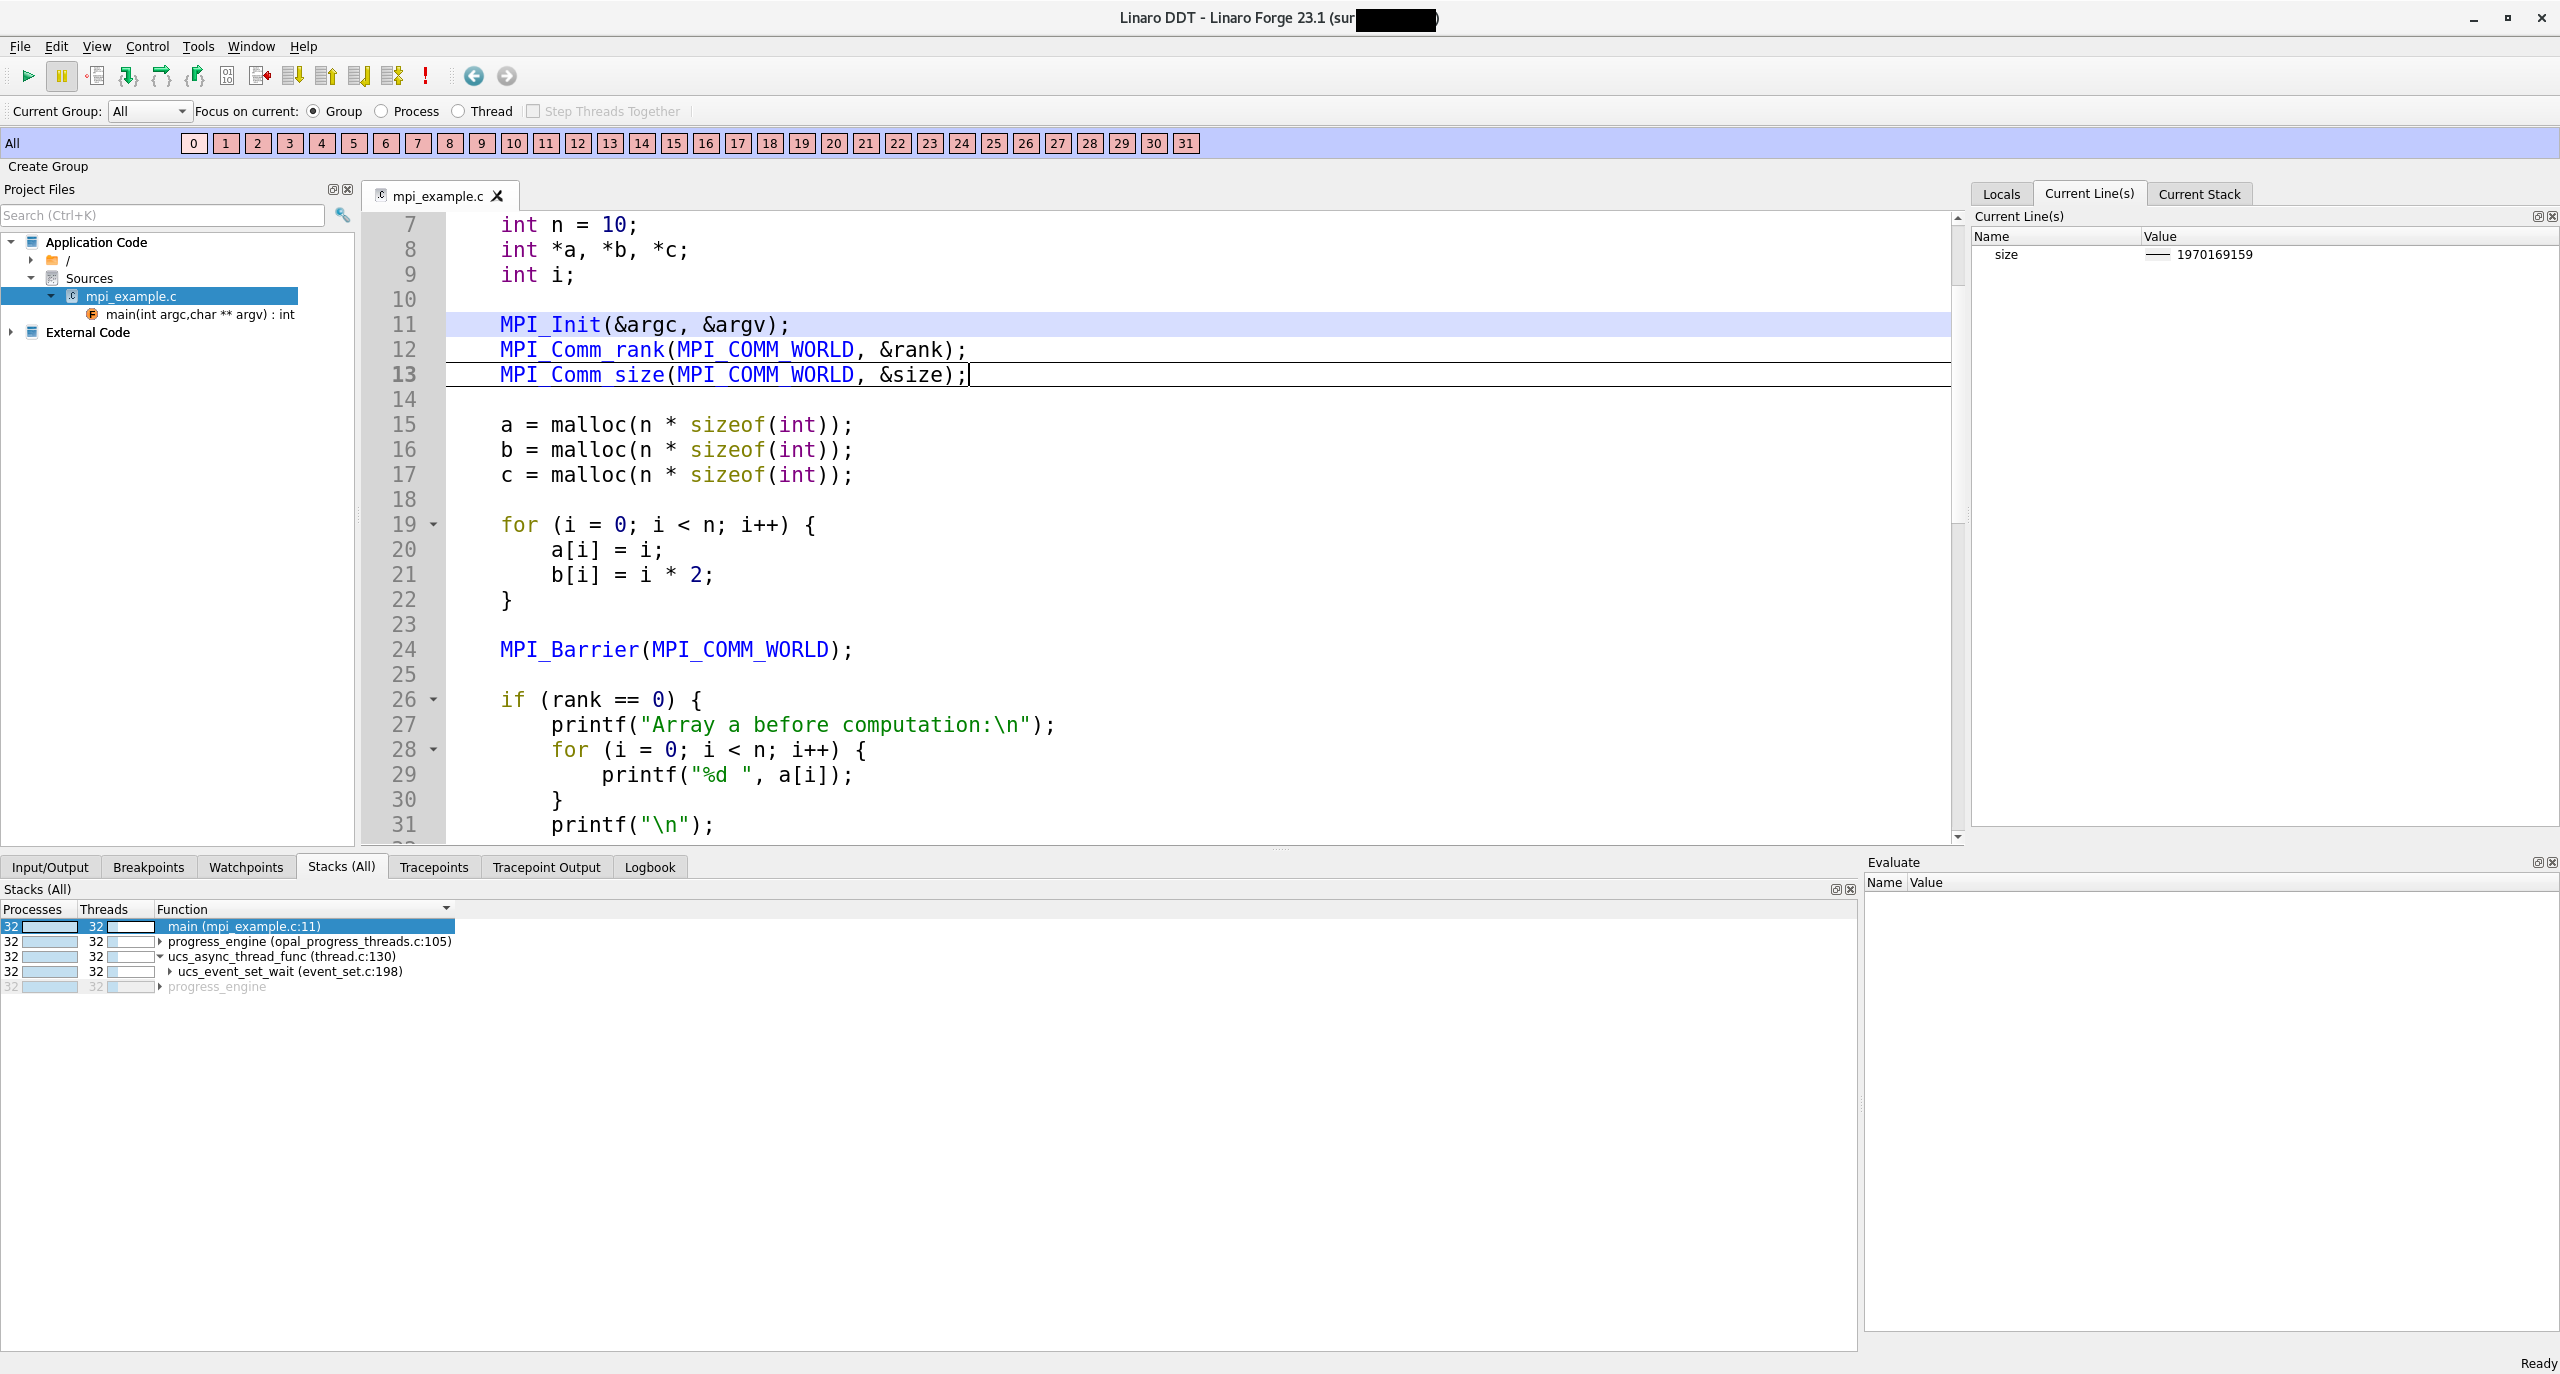
DDT with NiceDCV
If debugging with DDT requires more performance than what can provide the X11 forwarding, you may use NiceDCV. First, start ddt on NiceDCV.
$ module load linaro-forge
$ ddt
Then select Manual Launch and indicate the number of processes:
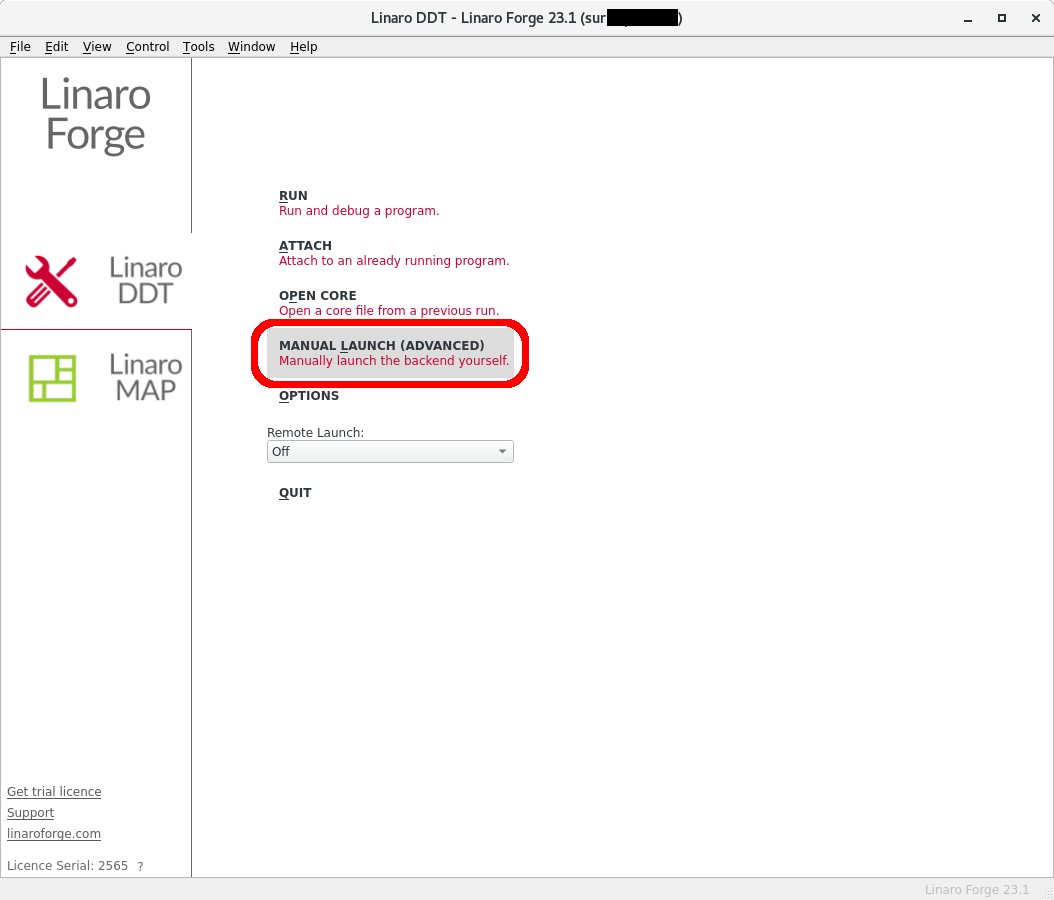
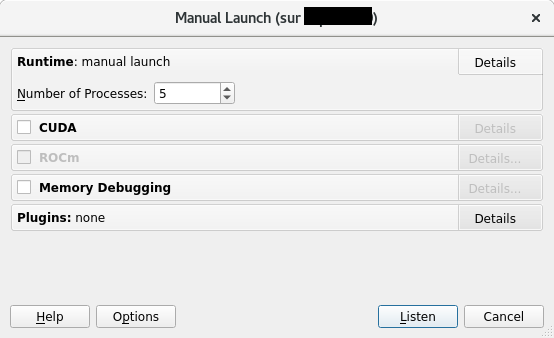
Then submit your code using the ddt-client command :
cat submit_visu.sh

#!/bin/bash
#MSUB -r TP4_debugging
#MSUB -n 16
#MSUB -T 1800
#MSUB -q <partition>
#MSUB -A <project>
#MSUB -m work,scratch
#MSUB -e TP4_debugging_%J.err
#MSUB -o TP4_debugging_%J.out

ml purge
ml mpi

ml linaro-forge
ccc_mprun ddt-client  ./cstartmpi
DDT should be able to catch the launch and you may use DDT as usual.
Note
Linaro-forge DDT is a licensed product.
A full documentation is available in the installation path on the cluster. To open it:
$ evince ${LINAROFORGE_ROOT}/doc/userguide-forge.pdf
Advanced: debug MPMD scripts
Prior to start ddt you need to create an appropriate script in MPMD mode:
$ cat ddt.job
#!/bin/bash
#MSUB -r MyJob_Para       # Job name
#MSUB -q <partition>      # Partition name
#MSUB -A <project>        # Project ID
#MSUB -n 4                # Number of tasks to use
#MSUB -T 1800             # Elapsed time limit in seconds
#MSUB -X
#MSUB -o example_%I.o     # Standard output. %I is the job id
#MSUB -e example_%I.e     # Error output. %I is the job id
set -x
cd ${BRIDGE_MSUB_PWD}

module load linaro-forge
cat << END > exe.conf
1   env ddt-client ./algo1
3   env ddt-client ./algo2
END

ccc_mprun -f exe.conf
Now, as well as before, load the appropriate module:
$ module load linaro-forge
Then start ddt:
$ ddt&
Once ddt interface is visible, select MANUAL LAUNCH:
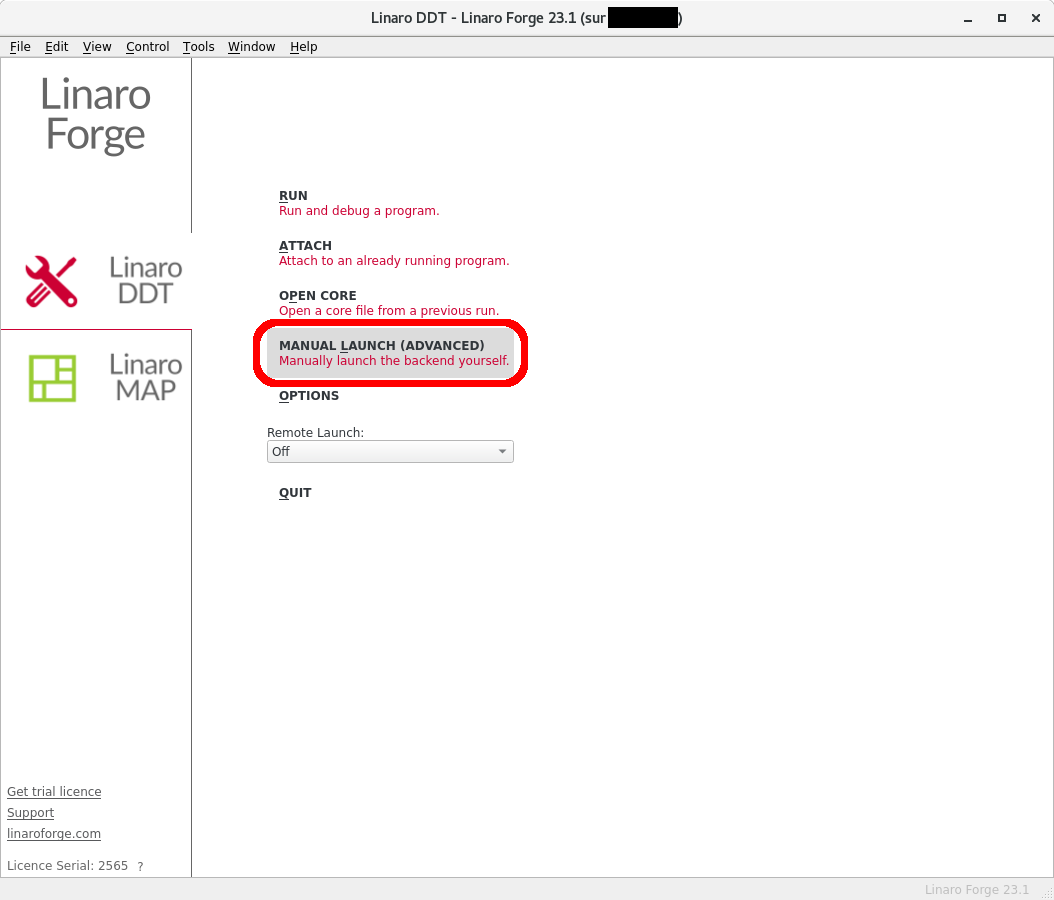
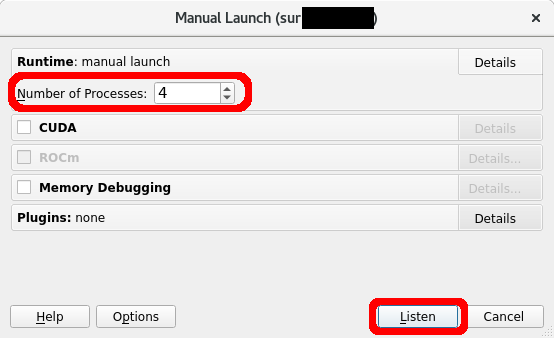
Select the same number of processes that you choose on your script at #MSUB -n (4 here) and press Listen:
Then, launch your script:
$ ccc_msub -X ddt.job
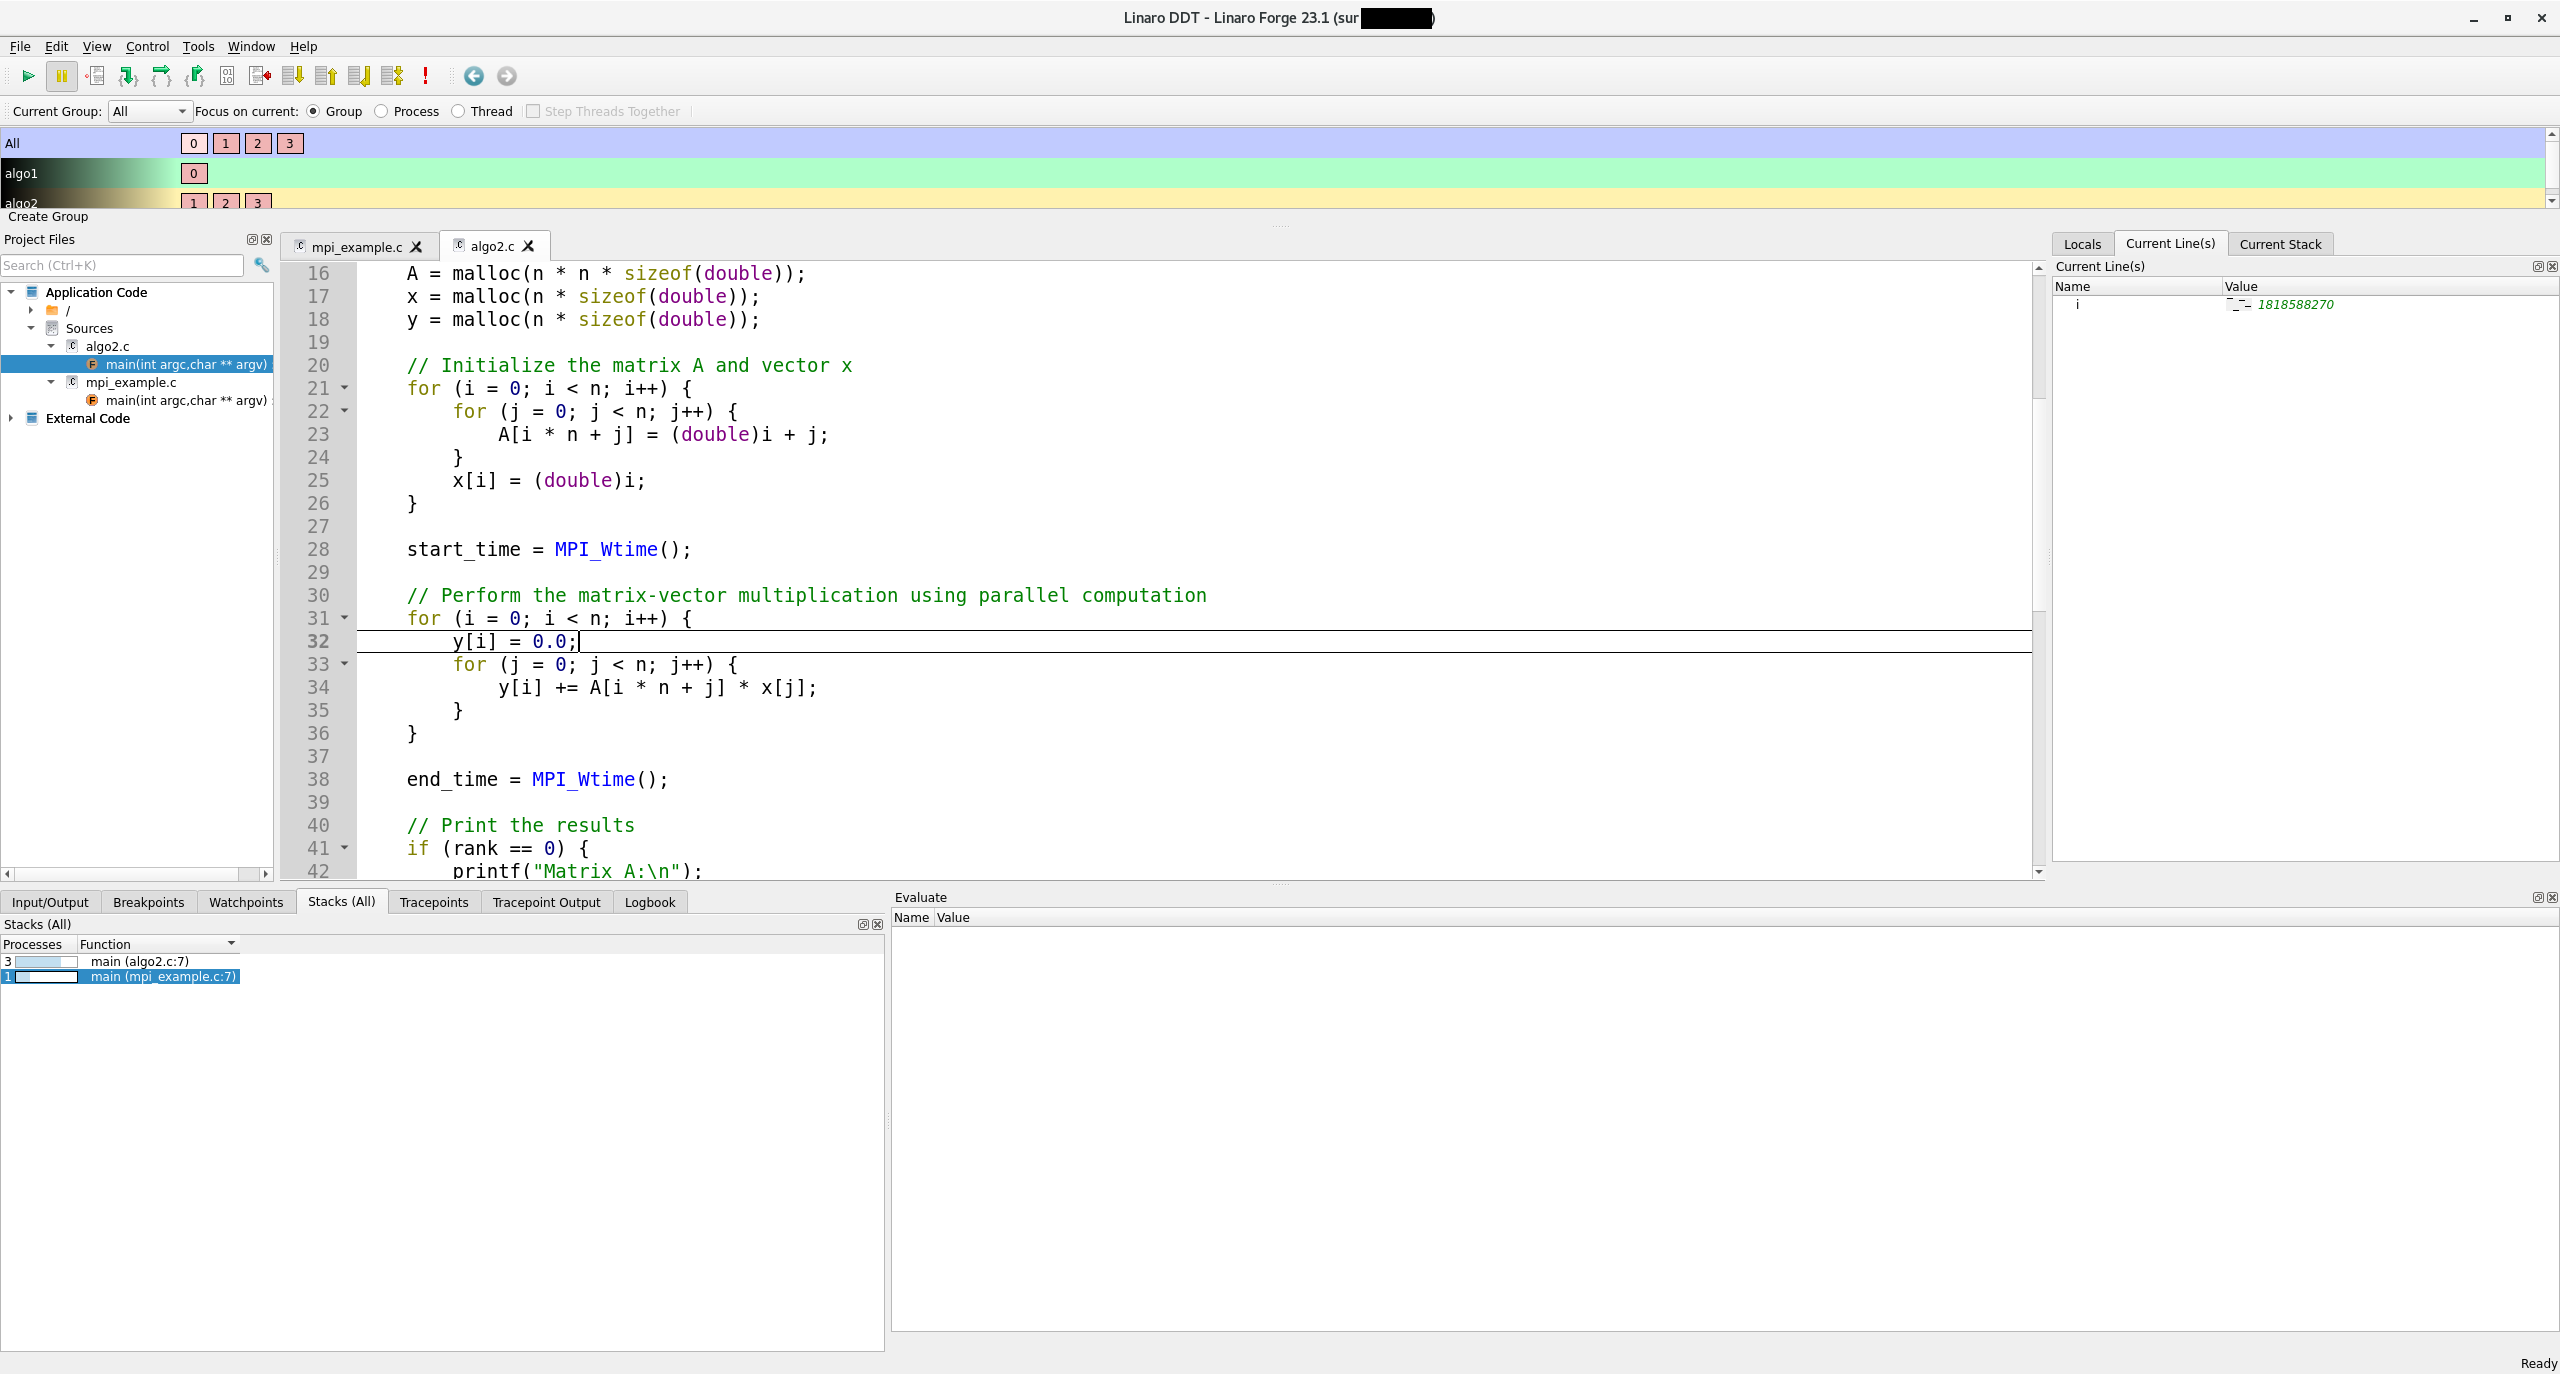
Wait and your job will be automatically attach to ddt. Now you have an an interface with algo1 and algo2 running at the same time:
TotalView
TotalView can be launched in two different ways.
By launching the parallel tasks with Totalview
TotalView may be used by loading the module, opening the GUI and then use the slurm parallel system. Firstly you have to load the module:
$ module load totalview
Then launch your job with a submission script like:
#!/bin/bash
#MSUB -r MyJob             # Job name
#MSUB -q <partition>       # Partition name
#MSUB -A <project>         # Project ID
#MSUB -n 8                 # Number of tasks to use
#MSUB -T 600               # Time limit
#MSUB -o totalview_%I.o    # Standard output. %I is the job id
#MSUB -e totalview_%I.e    # Error output. %I is the job id
set -x
cd ${BRIDGE_MSUB_PWD}
totalview
Then the GUI will open, in the “File” tab, choose “Debug a parallel program”. Then use the parallel system “SLURM”.
By using the wrapper ccc_mprun -d
It may also be used by loading the module and by submitting an appropriate job which will use the ccc_mprun wrapper for Totalview:
$ module load totalview
Then launch your job with a submission script like:
#!/bin/bash
#MSUB -r MyJob             # Job name
#MSUB -q <partition>       # Partition name
#MSUB -A <project>         # Project ID
#MSUB -n 8                 # Number of tasks to use
#MSUB -T 600               # Time limit
#MSUB -o totalview_%I.o    # Standard output. %I is the job id
#MSUB -e totalview_%I.e    # Error output. %I is the job id
set -x
cd ${BRIDGE_MSUB_PWD}
ccc_mprun -d tv ./totalview_test
It needs to be submitted with:
$ ccc_msub -X totalview.job
Totalview should open on the Startup Parameters window. There is nothing to change here, just hit OK. Once in the main window, you can either come back to the parameter window with “<ctrl-a>” or launch the code with “g”.
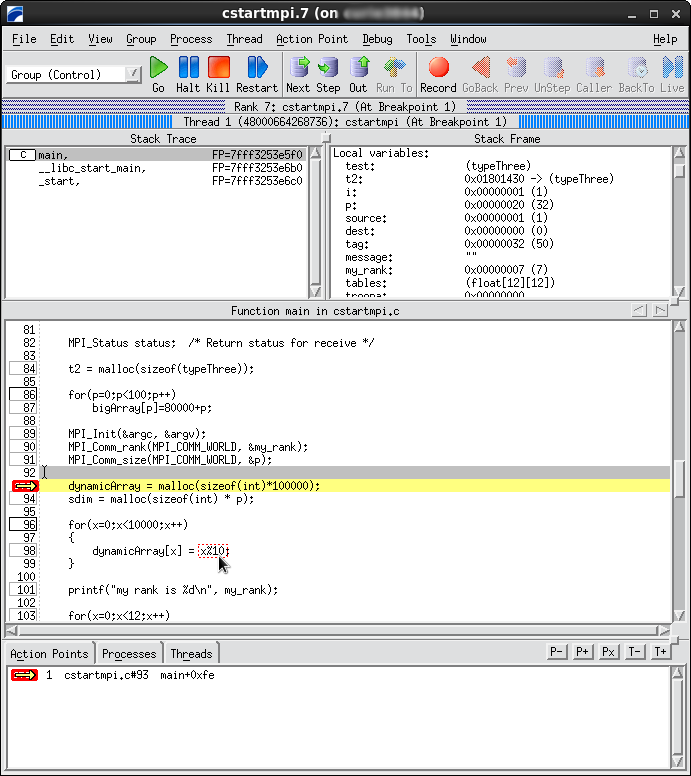
Example of Totalview window
Note
Totalview is a licensed product.
Check the output of module show totalview or module help totalview to get more information on the amount of licenses available.
A full documentation is available in the installation path on the cluster. To open it:
$ evince ${TOTALVIEW_ROOT}/doc/pdf/TotalView_User_Guide.pdf
Pdb Python debugger
pdb is a built-in Python debugger that aids in inspecting your code, setting breakpoints, and understanding program flow.
First of all, load python3 module:
$ module load python3
To start pdb when running your script, use the python command -m pdb option:
$ python3 -m pdb monte_carlo_pi.py
> monte_carlo_pi.py(1)<module>()
-> import random
(Pdb) ...
A prompt is opened, use help command:
(Pdb) help

Documented commands (type help <topic>):
========================================
EOF    c          d        h         list      q        rv       undisplay
a      cl         debug    help      ll        quit     s        unt
alias  clear      disable  ignore    longlist  r        source   until
args   commands   display  interact  n         restart  step     up
b      condition  down     j         next      return   tbreak   w
break  cont       enable   jump      p         retval   u        whatis
bt     continue   exit     l         pp        run      unalias  where
Use help <topic> for more information about any command:
(Pdb) help a
a(rgs)
     Print the argument list of the current function.
Use a breakpoint (break <file>:<line>) to stop the code when a file line is reached:
(Pdb) break monte_carlo_pi.py:10
Breakpoint 1 at monte_carlo_pi.py:10
(Pdb) continue
> monte_carlo_pi.py(10)estimate_pi()
-> distance = x**2 + y**2
Use list . command to list the current code:
(Pdb) list .
  3         def estimate_pi(num_points):
  4             points_in_circle = 0
  5
  6             for _ in range(num_points):
  7                 x = random.uniform(0, 1)
  8                 y = random.uniform(0, 1)
  9
 10 B->             distance = x**2 + y**2
 11                 if distance <= 1:
 12                     points_in_circle += 1
 13
 14             return 4 * points_in_circle / num_points
Note the B for Breakpoint and -> indicates the current line.
Pdb is able to print values with p or pp commands:
(Pdb) p distance
*** NameError: name 'distance' is not defined
If you are looking for any local variable, use locals() function:
(Pdb) locals()
{'num_points': 10000000, 'points_in_circle': 0, '_': 0, 'x': 0.2584912119080409, 'y': 0.6628071583040221}
Note there is a equivalent for globals() but could be very long.
With the next command, execute the code line per line:
(Pdb) next
> /ccc/work/cont000/asplus/cotte/cProfile/monte_carlo_pi.py(11)estimate_pi()
-> if distance <= 1:
(Pdb) p distance
0.5061310357327408
(Pdb) ll
  3         def estimate_pi(num_points):
  4             points_in_circle = 0
  5
  6             for _ in range(num_points):
  7                 x = random.uniform(0, 1)
  8                 y = random.uniform(0, 1)
  9
 10 B               distance = x**2 + y**2
 11  ->             if distance <= 1:
 12                     points_in_circle += 1
 13
 14             return 4 * points_in_circle / num_points
Note the -> has moved and distance is defined now.
Here are the main usefull commands:
Command |
Description |
|---|---|
b(reak) |
Set a breakpoint at specified line number or function, with an optional condition. |
c(ont) |
Continue execution, only stop when a breakpoint is encountered. |
l(ist) |
Displays 11 lines around the current line (l .) or continue the previous listing. |
ll |
List the whole source code for the current function or frame. |
p / pp |
Evaluate and print the expression in Python syntax. Use pp for tables/structures. |
locals() |
Return a dictionary of the current namespace. |
globals() |
Return a dictionary of the current global namespace. |
s(tep) |
Execute the current line, stop at the first possible occasion. |
n(ext) |
Continue execution until the next line in the current function is reached or it returns. |
r(eturn) |
Continue execution until the current function returns. |
q(uit) |
Quit from the debugger. |
For more information, please refer to the official Python documentation.
Other tools
Valgrind Memcheck
Valgrind is an instrumentation framework for dynamic analysis tools. It comes with a set of tools for profiling and debugging.
Memcheck is a memory error detector. It is the default use of Valgrind so any call to valgrind is equivalent to calling
$ valgrind --tools=memcheck
To check your code with Valgrind, just call valgrind before the program :
$ module load valgrind
$ valgrind ./test
To run MPI programs under Valgrind, use the available library “libmpiwrap” to filter false positives on MPI functions. It is available through the VALGRIND_PRELOAD environment variable. It is also possible to specify the output file and to force Valgrind to output one file per process (with --log-file).
#!/bin/bash
#MSUB -n 32
#MSUB -T 1800
#MSUB -q <partition>
#MSUB -A <project>

module load valgrind

export LD_PRELOAD=${VALGRIND_PRELOAD}

ccc_mprun valgrind --log-file=valgrind_%q{SLURM_JOBID}_%q{SLURM_PROCID} ./test
Here is the kind of output Valgrind returns :
==22860== Invalid write of size 4
==22860== at 0x4005DD: func1 (test1.c:12)
==22860== by 0x40061E: main (test1.c:20)
==22860== Address 0x4c11068 is 0 bytes after a block of size 40 alloc'd
==22860== at 0x4A05FDE: malloc (vg_replace_malloc.c:236)
==22860== by 0x4005B0: func1(test1.c:9)
==22860== by 0x40061E: main (test1.c:20)